The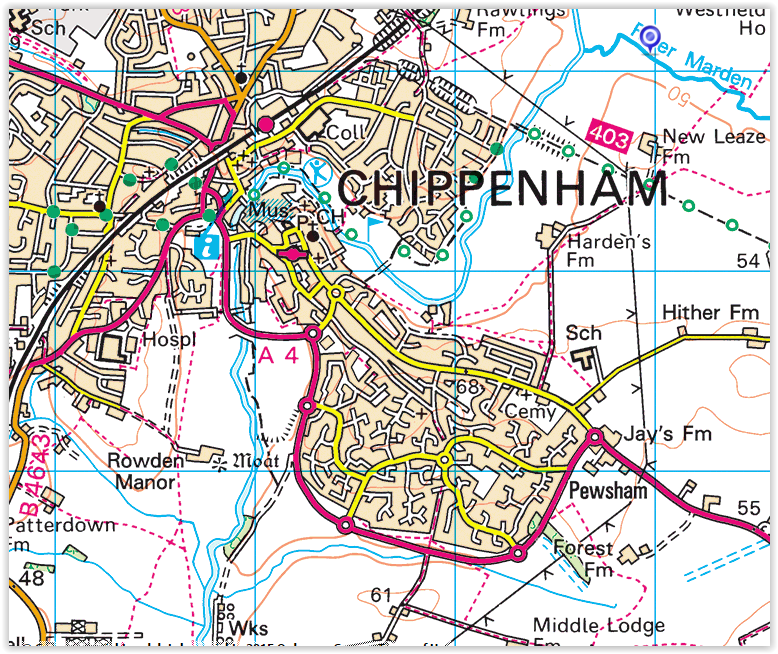 hydrogeomorphological approach was applied to 10km of the river Avon in Chippenham. The aim of this case study was to demonstrate the relevance and potential use of the hydrogeomorphological method for the assessment of flood risk in UK rivers.
The case study was carried out in partnership with EdenvaleYoung Associates.
Objectives:
- Application of the hydrogeomorphological method to a British river alongside traditional hydraulic modelling techniques.
- Comparison of flood risk boundaries produced by the hydrogeomorphological methods and by hydraulic models.
- Assessment of flooding frequencies associated with flood boundaries identified by the hydrogeomorphological method using hydraulic models and historical data.
Material: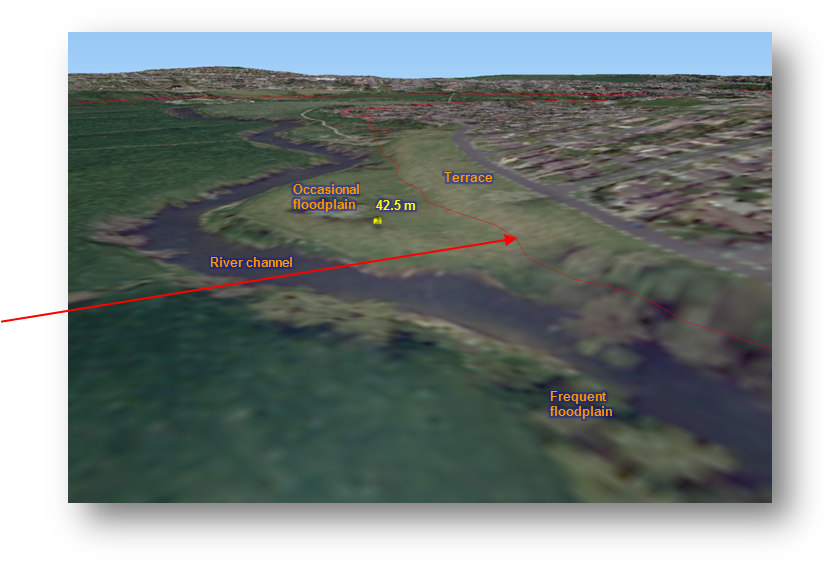
- Geological maps
- Topographical maps and aerial photo
- Lidar data (DEM)
Because of the lack of stereoscopic aerial photography, we used a three-dimensional model generated using lidar data and aerial photography in QGIS.
This provided a morpho-topographical model that could be used to identify
hydrogeomorphological units and delineate the outer limits of the flooding area (interface between the floodplain and hill slope).
The map was then refined during field work where the exact nature of hydrogeomorphological units was identified using clues such as breaks in slope, vegetation and sediment change .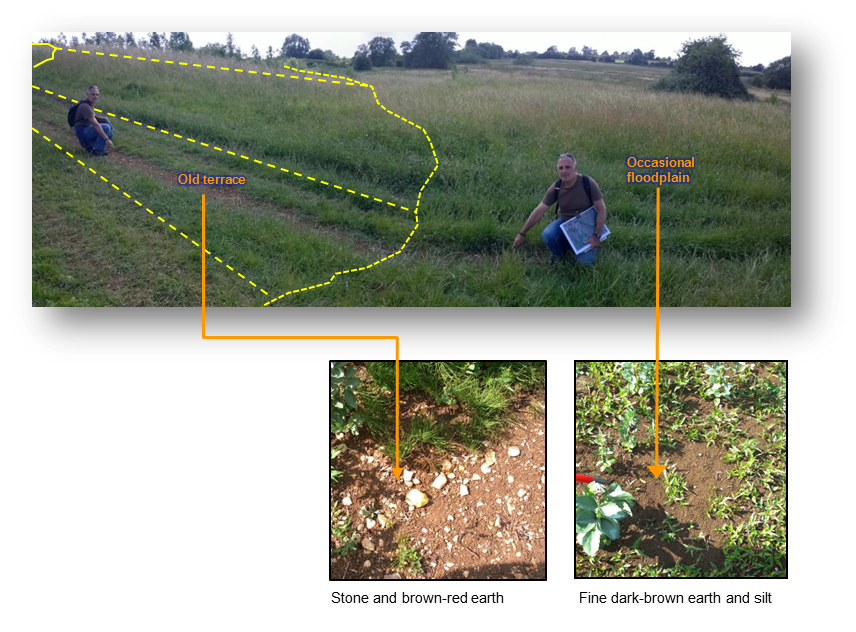
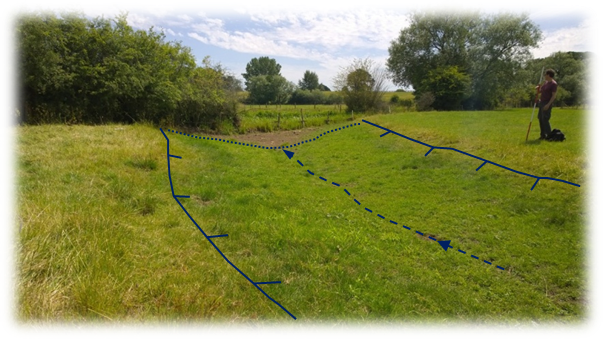 Additional flood features such as flood runners and flood channels were also identified and mapped. These features are important for conveying floods during high flows and may impact on erosion and deposition processes as well as flooding. Flood boundaries in urban areas were validated using visual clues and markers of previous floods on buildings and structures (e.g. bridges).
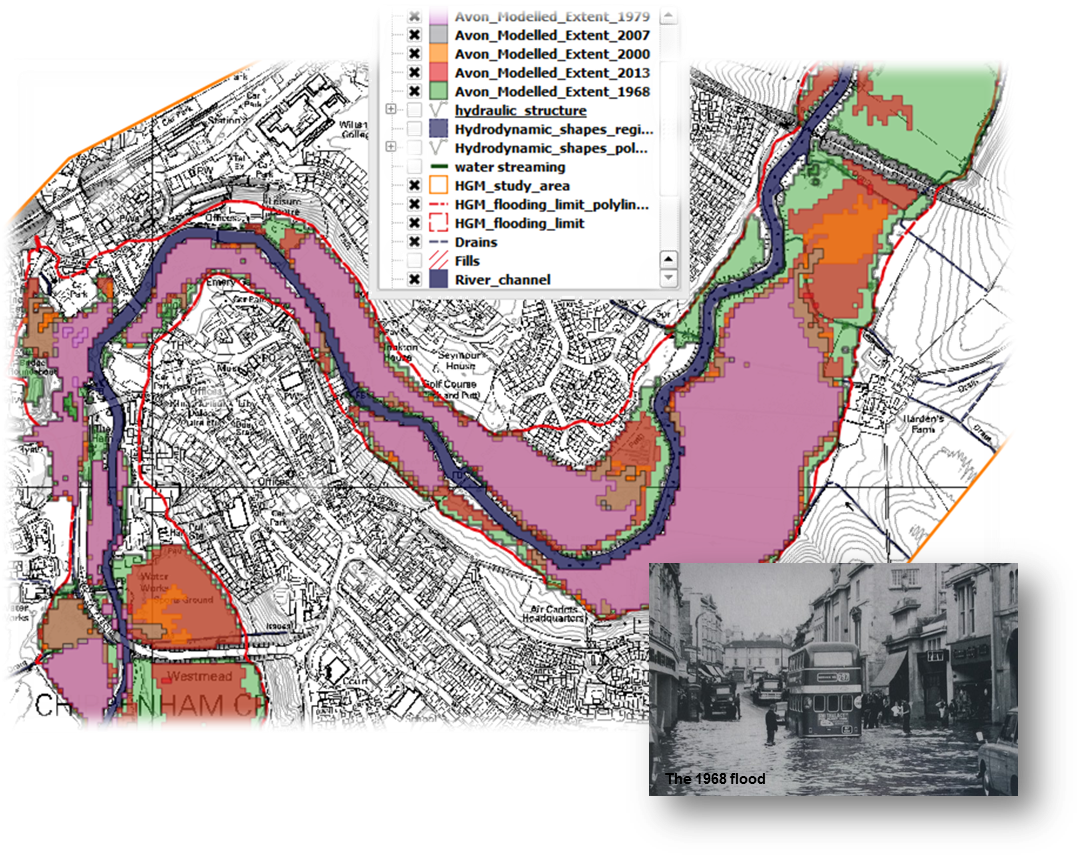
Using the information, a final map of Chippenham’s flood boundaries was produced in QGIS. The outputs were compared to models of historic floods (1968 was the largest flood on record). All recorded floods fell within (and matched) the boundaries identified using the hydrogeomorphological method.
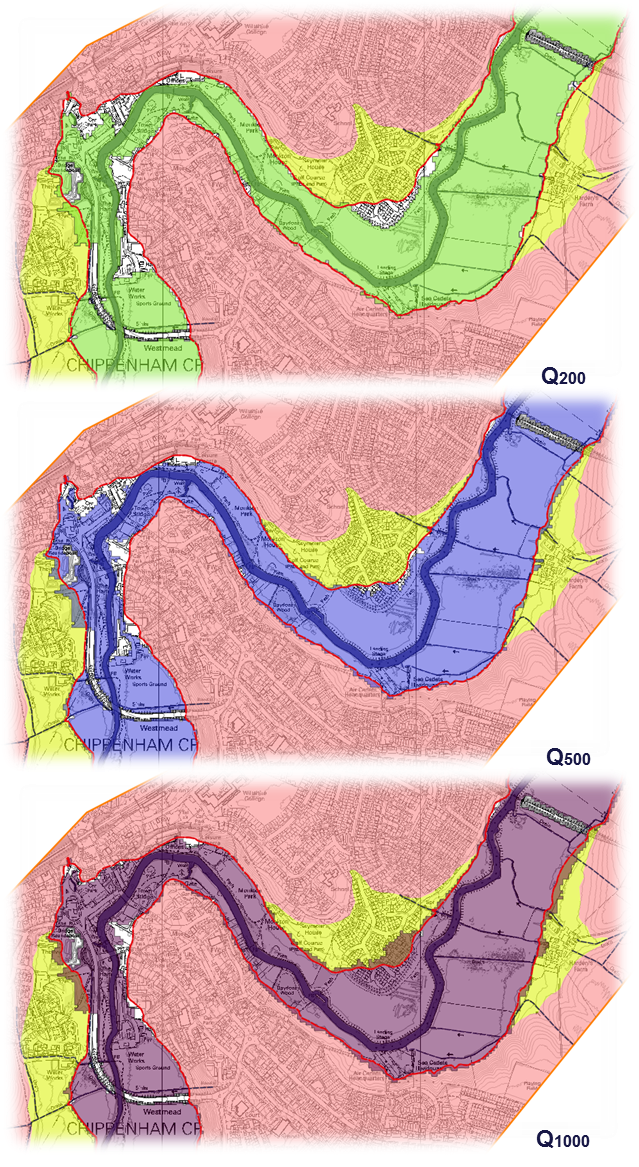
The boundaries were also compared to simulated floods for increasing return periods. The boundaries identified using the hydrogeomorphological method seemed to correspond to a return period between 500 and 1000 years.
Cost-effectiveness:
The overall assessment was completed in 15 man-days by 2 operators. The aerial data analysis was carried out in 4 days, the field work was completed in 5 days (2.5 days x 2 surveyors) and the final processing of the data and maps took 6 days.
This compares to in excess of 4 months for running the hydraulic models. This is in line with previous experience abroad where the cost of the hydrogeomorphological method was estimated to be about 1/5th (20%) of modelling costs (not including equipment).
Conclusion:
- The Chippenham case study demonstrates the potential of using the hydrogeomorphological method for identifying flood risk boundaries for frequent to more exceptional floods.
- The method is compatible and comparable to hydraulic modelling outputs and provides a framework for assessing flood risk in a cost-effective way (useful for screening risks) and validating simulation models along with historical data analysis.

- All three methods are complementary and should ideally be used in combination as they provide similar information and prediction from different perspectives thus building a burden of evidence for flood risk assessment.
- The method could ideally be applied for screening flood risk in areas not yet covered by exisiting models or for identifying natural boundaries for exceptional floods in areas that have been modified and urbanised.
- The method is ideally suited to places where resources and skills for hydraulic modelling are scarce and where detailed elevation, hydrological and meteorological data are not available (e.g. developing countries or remote areas).
- The method is also adapted to participatory approaches to flood risk management as local communities can be involved in the delineation of flood boundaries and local experts can be trained in applying the methodology (see training course section). The GIS outputs and 3D representations (see below) were derived using freeware (QGIS training available).
For more information on the technique and application, download the pdf version of the method and application by clicking here.
Take a flight!
Fly over a 3-dimensional representation of the River Avon floodplain and flood boundary using the following map (Click the photo). Please beware that, depending on available bandwidth, it may take in excess of 1 minute for the 3D representation to load. You can switch on and off the various layers by using the black panel in the top-right corner. To navigate, the map, you can use your mouse or keyboard (click on the help link for more information).
Alternatively, you can view a fly-over video using the video link below.
You must be logged in to post a comment.